.png?width=2400&name=Auryc-product-announcement-new-executive-insight-dashboard-mission-control-center-for-cx-customer-experience%20(1).png)
Introducing Auryc's NEW Executive Insights Dashboard!
This new dashboard summarizes the Key Metrics that measure the health of your site or mobile app from various angles, including:
- Users
- Revenue
- Cart Abandonment
- Site Performances and Revenue Impact
- Path Analysis
- Web Vitals
- NPS, Star Rating
- Feedback/Survey Keywords
- Industry Benchmark Comparison
The Insights Dashboard will be your new mission control center to easily understand site performance, customer sentiment, and overall customer experience health... Spot issues quicker and take action faster with this new dashboard.
Let’s take a deep dive into each section of the new Insights Dashboard:
Vital Metrics
Introducing Auryc's Vital Metrics. These are the top-line metrics that often start conversations about key data points that brands rely upon to measure health, including User Metrics, Revenue Metrics, and Abandonment Metrics. These help you pinpoint any alarming trends quickly and peel back the layers to uncover root causes.
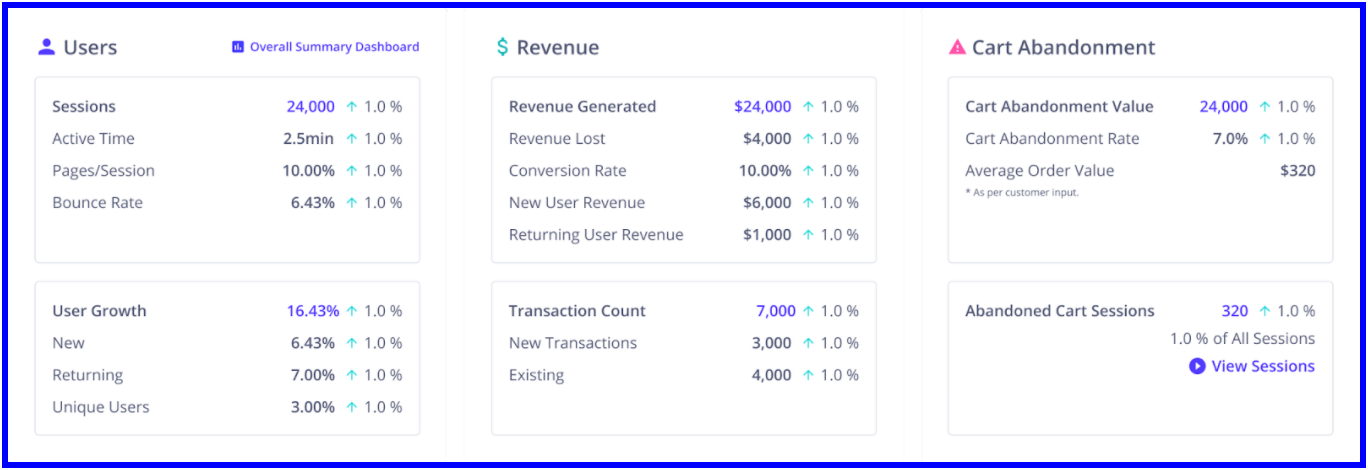
User Metrics
- Number of Sessions in the selected date range
- Average Active Time per Session
- Number of Pages-per-Session Viewed
- Bounce Rate (users who landed and closed the site/app immediately)
- New vs Returning vs Unique Users
Revenue Metrics
(Estimated based on Users in the path of Conversion x the Average Order Value (AOV), which can be adjusted as needed)- Revenue Generated in the selected date range
- Revenue Lost in the selected date range
- Overall Conversion Rate in the selected date range
- New vs Returning User Revenue Generation
- New vs Returning User Transactions
Abandonment Metrics
- Estimated Revenue Loss due to Cart Abandonment
- Cart Abandonment Rate/Session
Visitor Information
At-a-glance metrics about where your visitors are coming from and how they access your site.
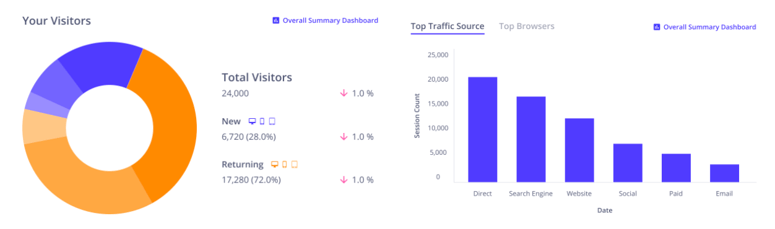
Your Visitor Widget
- New/Returning User Device Type
- End-User Traffic Sources
- Mobile/Desktop Browser Breakdown
Site Performance and Revenue Impact
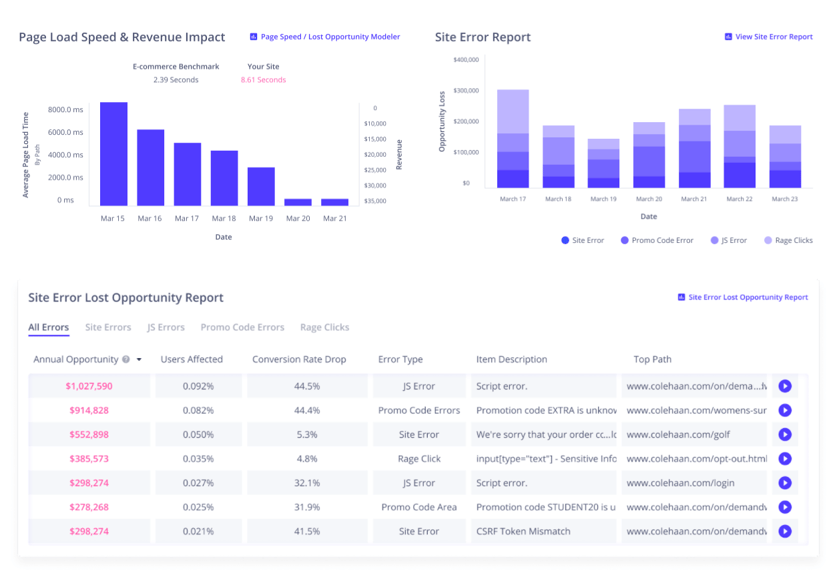
Page Load Revenue Impact Report
- Visualize and analyze your site’s daily speed, dollar impact, and deep dive to learn more about Backend/Frontend/API call Response rate.
Site Error Report
- Site Errors are the key experience blockers - understand what they are, why it is happening, and how you can mitigate them.
Site Error Lost Opportunity Report
- Gain deeper insight into the lost revenue caused by site errors. (Estimated based on Users in the path of Conversion x the AOV, which can be adjusted as needed).
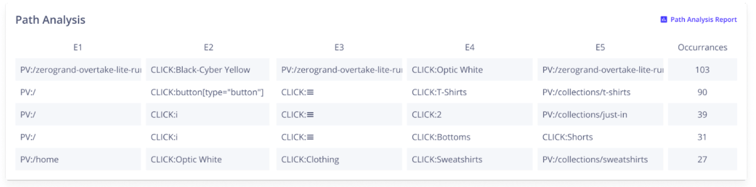
Path Analysis
Easily surface the top paths to purchase and identify opportunities to optimize lesser performing paths for greater performance.
Core Web Vitals
Learn about your site and dive deeper into advanced reports to understand the bottom-line impact of core web vitals on your site's performance. Begin by surfacing which page types are having the biggest issues, and then look at individual pages to understand at the granular level what is affecting the on-page experience.
New to Core Web Vitals? Learn more about them here
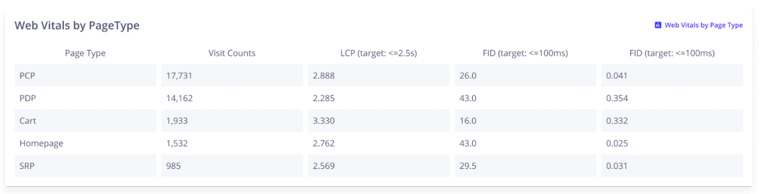
- Loading (LCP)
- Interactivity (FID)
- Visual Stability (CLS)
Voice of the Customer Analysis
No CX dashboard would be complete without Voice of the Customer data that has been gathered via Auryc's customer feedback studio where you can collect NPS scores, star ratings, free-response feedback, and more. Plus, you'll quickly get the signals through the noise thanks to Auryc's AI-powered sentiment analysis which highlights top trending issues your customers are facing on your site or mobile app.
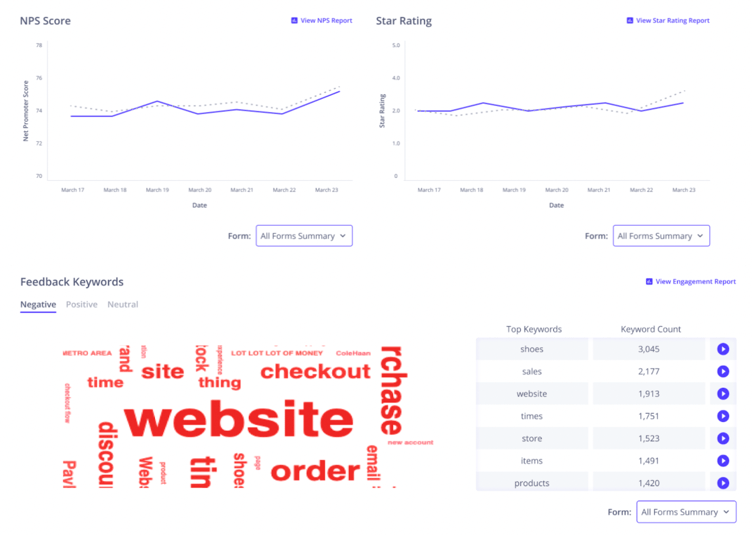
NPS/Star Rating
- NPS metrics and trends
- Star Ratings and Trends
Feedback Keyword Sentiment
- Feedback Word Clouds for insights into top frustrations
- AI-Powered Sentiment Analysis (positive, negative, neutral)
- Access deeper Sentiment Analysis through Updated Engagement Reports
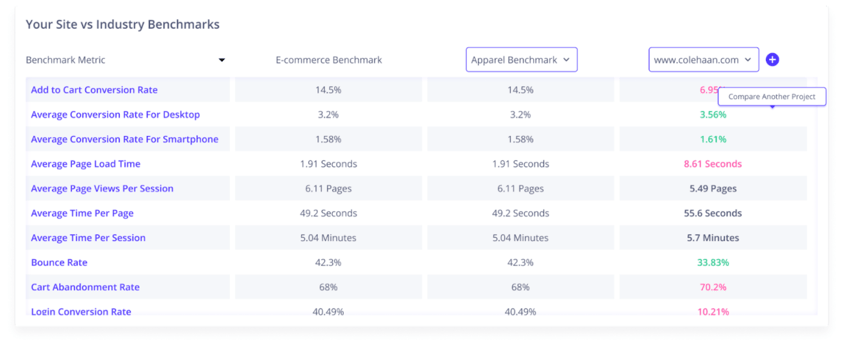
Industry Benchmarks
Compare your site’s performance within your own industry or across other industries as well. Finally, see if you are over / under performing for your industry.
With this much insight available in just our new executive insight dashboard, it's no wonder why thousands of CX-obsessed professionals have happily made the switch to Auryc's Customer Experience Intelligence Platform. Request a demo today and see for yourself.
Get Your Personalized Demo of Auryc >>
Get Your Personalized Demo of Auryc >>